Mandelbrot Fractal
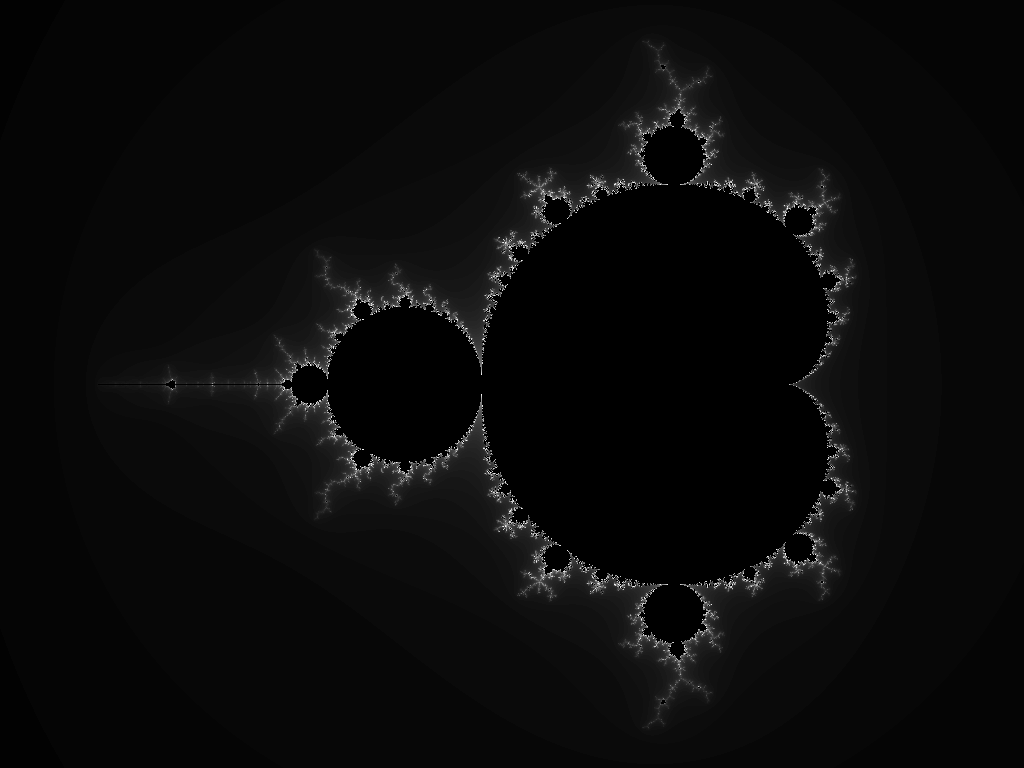
Fractals are interesting because they show how infinite complexity can emerge from something simple. Here is a quick little article on the Mandelbrot set.
Hover mouse or touch to see iterations starting at that point.
All the complexity of the Mandelbrot set comes from a simple formula:
$$ z_{n+1} = z_n^2 + c $$The variables \(z\) and \(c\) are complex numbers (having a real and an imaginary part). The \(z_{n+1}\) means that the value of the next iteration is arrived at using the value of the current \(z_n\) iteration. The more iterations a Mandelbrot fractal generation application uses, the more correct the rendered image will be, but it will take longer to draw because each pixel in the image is sampling this formula at a pixel in the complex plane. For the demonstration above, only 100 max iterations were used (more will be needed if zooming in on details had been implemented).
The \(x\) axis of the image is being used to map the real component of the complex numbers, and the \(y\) axis is the imaginary component. Keep in mind, the Mandelbrot fractal fits in a pretty small range of values, so points will be scaled to fit the range of the much larger image coordinates.
$$ \begin{aligned} z_0 &= 0 + 0i \\ c &= x + yi \end{aligned} $$What is inside the set are points that get “trapped” within some range of values (the black part of the image), and what is outside the set are points that go out farther and farther an unbounded amount. The coloration around the Mandelbrot set is based on how many iterations were needed to determine that a point not in the set – giving it a more pleasant glowing appearance.
You can see what I mean by the iterations being “trapped” or not by hovering your mouse or touching your finger on the Mandelbrot fractal to see the path the iterations had taken when starting at that point.
The math for performing each iteration step is pretty simple – all you need to know is basic algebra. Adding complex numbers is easy – it’s just like regular algebra when adding variables.
$$ (a + bi) + (c + di) = (a + c) + (b + d)i $$For multiplication (squaring is multiplying something with itself), you need to understand what \(i\) (an imaginary number) is. If you don’t know the answer already, ponder what the square root of negative one might be. What number squared can become negative one? Well, no real number, so that is what an imaginary number is: \(i^2 = -1\).
So, squaring a complex number will look like:
$$ \begin{aligned} (x + yi)^2 = \\ (x + yi)(x + yi) = \\ x x + xyi + yxi + yiyi = \\ x^2 + 2xyi + y^2 i^2 = \\ x^2 + 2xyi + y^2 (-1) = \\ x^2 - y^2 + 2xyi = \\ (x^2 - y^2) + (2xy)i \end{aligned} $$The grouping at the end was added to make it clearer to see what is the “real” part and what is the “imaginary” part of the resulting complex number.
Here is a simple Python implementation that uses its built-in support of complex numbers and the Pillow library for image rendering:
from PIL import Image

MAX_ITER = 100
MAX_DIST = 6  # if |z|^2 exceeds this, the point has escaped

# Recommended values for a similar image to the one on this page
CENTER_X = -0.65
CENTER_Y = 0
ZOOM = 0.3


def mandelbrot_step(z, c):
    # Since Python supports complex numbers, we don't need to manually implement
    # squaring z and adding c to get the new point in the complex plane.
    return z * z + c


def map_image_point_to_mandelbrot(x, y, width, height, center_x, center_y, zoom):
    scale = 1 / (width * zoom)
    cx = (x - width / 2) * scale + center_x
    cy = (y - height / 2) * scale + center_y
    return complex(cx, cy)


def render_mandelbrot(width, height, center_x, center_y, zoom):
    img = Image.new("RGB", (width, height))
    pixels = img.load()

    for py in range(height):
        for px in range(width):
            c = map_image_point_to_mandelbrot(
                px, py, width, height, center_x, center_y, zoom
            )

            # Run the iteration for this point
            z = 0
            iterations = 0

            while iterations < MAX_ITER and z.real**2 + z.imag**2 < MAX_DIST:
                z = mandelbrot_step(z, c)
                iterations += 1

            # Points that never escaped are considered "in the set"
            in_set = iterations == MAX_ITER
            brightness = 0 if in_set else int(255 * (iterations / MAX_ITER))

            pixels[px, py] = (brightness, brightness, brightness)

    return img


image = render_mandelbrot(1024, 768, CENTER_X, CENTER_Y, ZOOM)
image.save("mandelbrot.png")
The resulting image from running the script:
This article briefly introduced the Mandelbrot fractal from a purely implementation focused perspective. For much more information about the Mandelbrot set, see the Wikipedia page.